
Challenge / Goal
With global customers, vendors and several acquisitions, a U.S. supply chain and logistics giant struggled to gain supply chain visibility using their traditional data management system. This led to delayed decision-making and impacted overall efficiency. Seeking a better solution, the company turned to Bridgenext (formerly Emtec Digital) to overcome challenges including:
- The absence of operational overview for enormous data and entities available in the system
- Difficulty combining data from multiple systems such as CargoWise and Quickbooks
- Lack of tools to identify data inconsistencies across entities
- No data security measures for critical customer data
- Lack of continuous ingestion of data, standardization, reporting and visualization
Solution
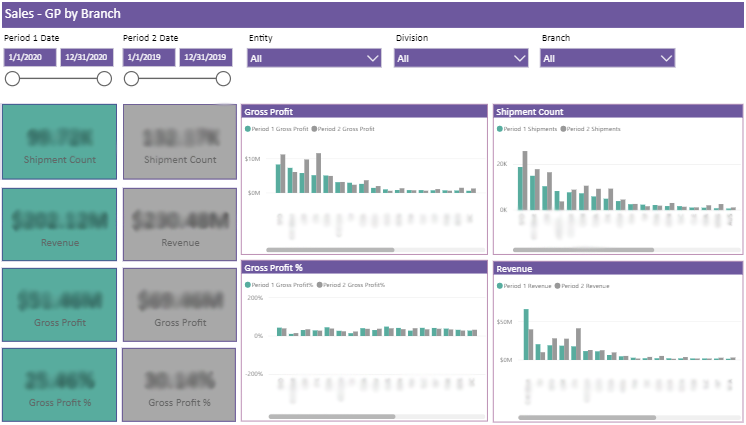
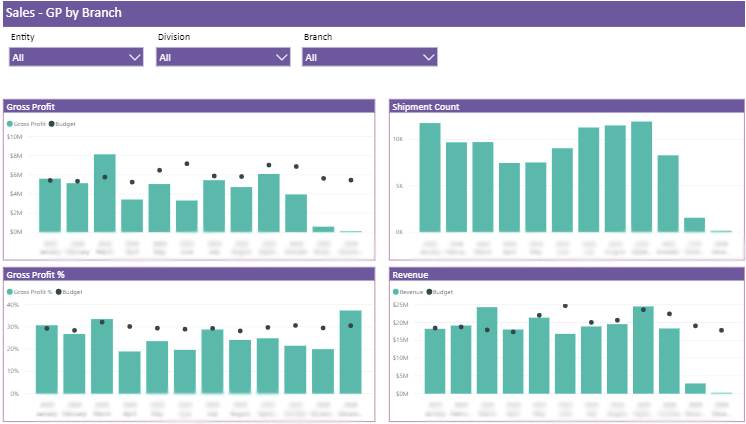
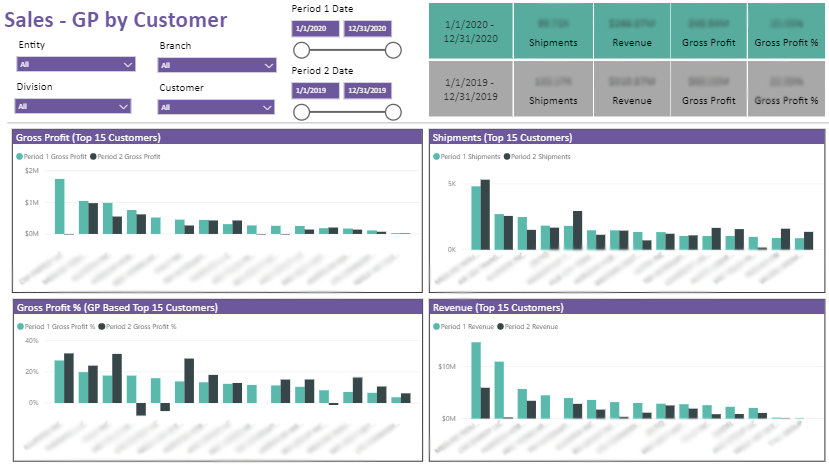
The primary objective of this project was to combine data from different acquired companies, entities, divisions, customers, regions and representatives. Our team strategically delivered a solution based on the MS Azure ecosystem. Our data engineers leveraged the power of BI and developed a centralized platform for data reporting and generating insights from multiple parameters, which resulted in improved decision-making.
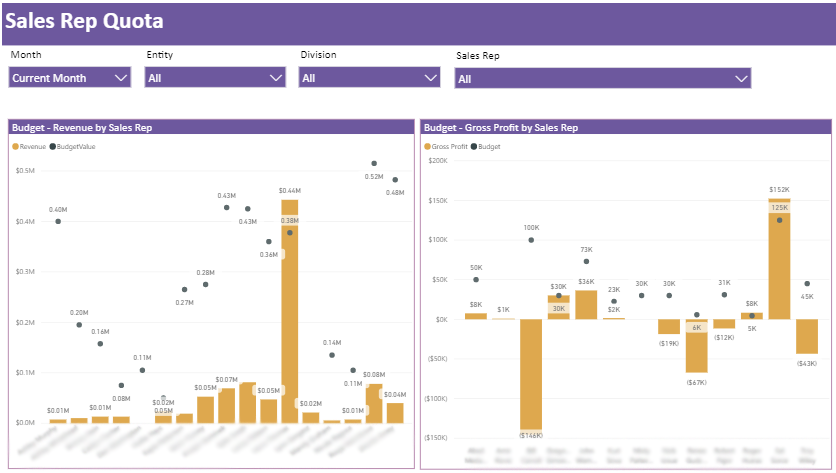
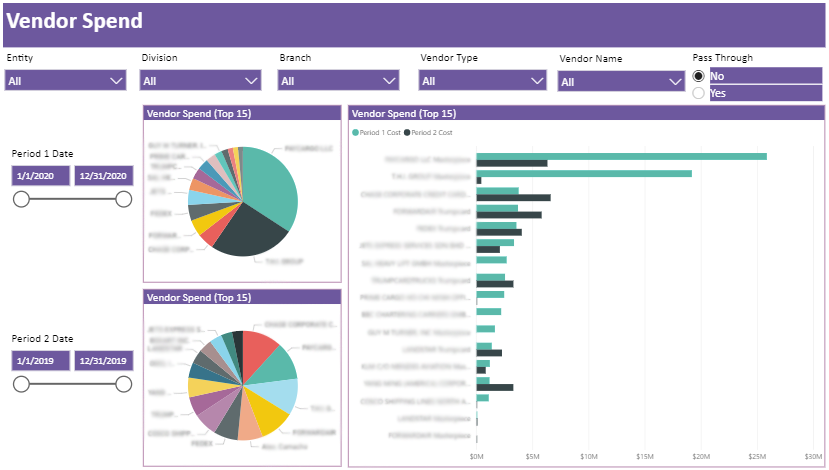
The new solution allowed enhanced data visualization, and various filters were added to support it. For example, sales reports were categorized by customer name, branch, resources, quota, etc., while other reports such as flash reports were maintained separately. This provided enhanced visibility into operational insights.
We created a single platform to monitor business processes by combining data from various sources. As a part of data aggregation, a unique ID was created to track the performances of multiple individuals and entities across the supply chain. We also leveraged some advanced Power BI features to obtain a summary of various customers, departments, sales representatives, locations and divisions, charge codes and vendor types. A provision was made to upload external data that had to be added daily through spreadsheets. It included details of overall sales budgets and damage claims.
Tech Stack
- Microsoft Azure Blob Storage
- Azure Functions
- Azure SQL
- Azure Analysis Services
- Power BI
- Microsoft .NET
- AngularJS

Results
- The advanced Power BI solution helped the client easily visualize data trends, patterns and supply chain operations to gain insights for quick decision-making
- The solution offered flexibility to merge data from various non-SQL sources and the SQL database
- The solution facilitated data import from multiple sources


